The Environmental Case for Synthetic Fertilizer
A Visual Explainer
-
-
Share
-
Share via Twitter -
Share via Facebook -
Share via Email
-
Nitrogen pollution is a pressing problem for ecosystem health and the climate. Large shares of nitrogen applied to farms as synthetic fertilizer or manure wash into rivers — causing algal blooms and killing off marine life — and contribute to greenhouse gas emissions. The impacts are so large that in 2018, a group of nitrogen experts determined that the world must halve the amount of nitrogen dumped into the environment to avoid the worst impacts on wildlife.
Many people argue that synthetic fertilizers are at the heart of the problem. Because synthetic fertilizers are the biggest contributor to nitrogen pollution, the thinking goes, we should radically limit their use, if not eliminate them entirely from the food system. The solution, in other words, lies in organic fertilizers such as animal manure.
However, this would be ineffective, infeasible, and counterproductive for several reasons. There is a strong environmental case to be made for synthetic fertilizer, captured in the suite of infographics below.
To view this infographic on a separate page, click here.
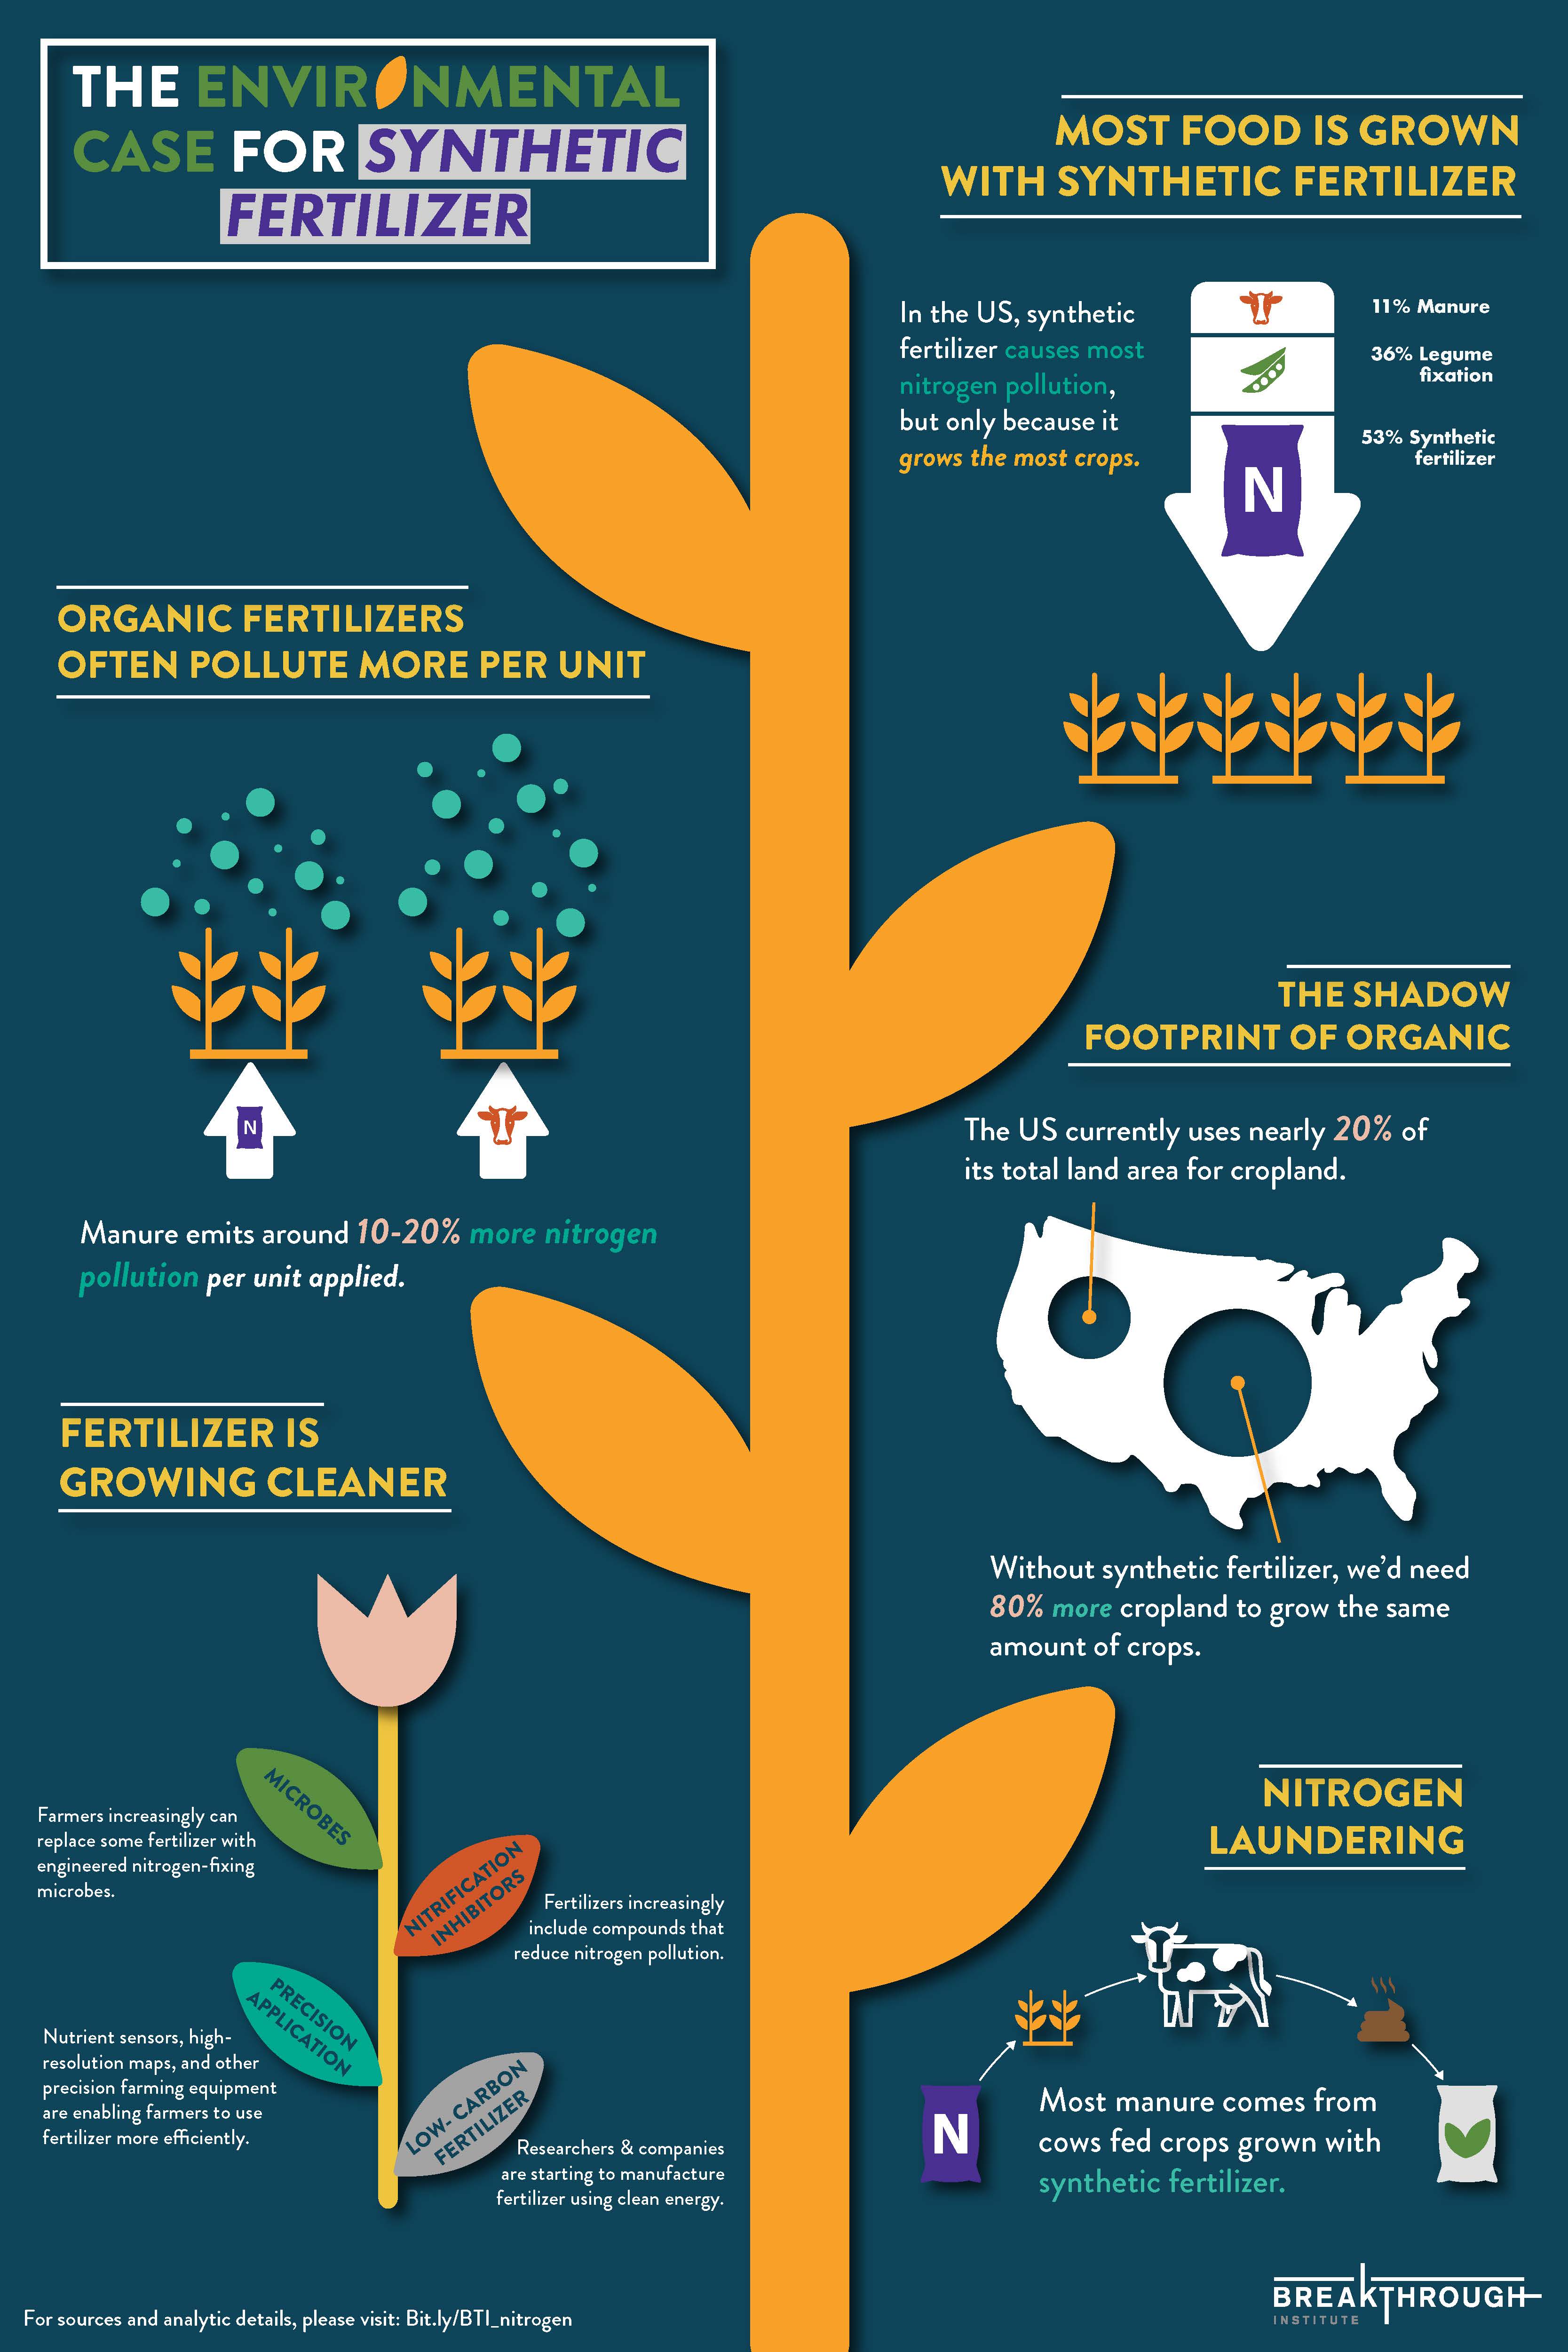
First, while we should make the best possible use of animal waste, applying manure to crops often generates even more nitrogen pollution than synthetic fertilizer. Synthetic fertilizers are responsible for the most pollution only because they are the most used, not because they are worse for the environment.
Second, doing away with synthetic fertilizer would expand the footprint of agriculture, threatening ecosystems and worsening climate change. Because there isn’t enough manure and compost, we would need to expand our use of other nitrogen sources (legumes and fallowing fields) that require extra land — a lot of extra land. Eliminating synthetic fertilizers would require an 80% increase in cropland.
Finally, focusing on replacing synthetic fertilizer overlooks more promising ways to reduce nitrogen pollution. For instance, farmers can adopt precision farming equipment that helps them apply just the right amount of fertilizer to their crops. These technologies include soil nutrient sensors, tractors with GPS and auto-steering, and machines that vary how much fertilizer they apply. Read more here about innovative ways to reduce nitrogen pollution from agriculture.
References & Calculations
Most Food Is Grown with Synthetic Fertilizer
Bouwman, A. F., Beusen, A. H. W., Lassaletta, L., Van Apeldoorn, D. F., Van Grinsven, H. J. M., & Zhang, J. (2017). Lessons from temporal and spatial patterns in global use of N and P fertilizer on cropland. Scientific reports, 7, 40366. Supplementary Datasets 2-7
Organic Fertilizers Often Pollute More Per Unit
USDA NRCS. (2017). Effects of Conservation Practices on Nitrogen Loss from Farm Fields: A National Assessment Based on the 2003-06 CEAP Survey and APEX Modeling Databases. p. 48. Note: Low end of range calculated using median values, high end using mean values. Values are for the amount of nitrogen lost per unit applied by farms using manure and those not using manure.
The Shadow Footprint of Organic
Lassaletta, L., Billen, G., Garnier, J., Bouwman, L., Velazquez, E., Mueller, N. D., & Gerber, J. S. (2016). Nitrogen use in the global food system: past trends and future trajectories of agronomic performance, pollution, trade, and dietary demand. Environmental Research Letters, 11(9), 095007.
Mueller, N. D., Lassaletta, L., Runck, B. C., Billen, G., Garnier, J., & Gerber, J. S. (2017). Declining spatial efficiency of global cropland nitrogen allocation. Global Biogeochemical Cycles, 31(2), 245-257.
USDA ERS. (2017) Summary table 1: Major uses of land, by region, State, and United States, 2012 [Data Set]. Accessed 2/22/2019 https://www.ers.usda.gov/data-products/major-land-uses/major-land-uses/
Calculation: Values calculated for North America, but are roughly applicable to the US. We estimate the additional land needed to keep crop production constant without synthetic fertilizer, assuming no changes in non-synthetic nitrogen availability (50% less nitrogen supply). We predict the amount of production possible without synthetic fertilizer using a hyperbolic model of crop production’s response to the fertilizer supply. Hyperbolic model fitting is conducted only for 1994-2009 data, following Mueller et al. (2017). This method predicts a 44% fall in production. During this period, several countries significantly improved agronomic performance and nitrogen use efficiency, improving yields while decreasing fertilization. Therefore using older data would overestimate the effect of reducing N supply on production. If NUE has improved since 2009, this analysis overestimates the effect of reducing N on yields. We assume that a proportionate amount of additional land is needed to make up for this decline.
Data on 2010 crop production and nitrogen inputs is from Lassaletta et al. (2016). Data on 2012 US acreage is from USDA ERS (2017).
May 6, 2019