Where Does Decarbonization Come From?
Nuclear, Hydro, and Economic Growth
-
-
Share
-
Share via Twitter -
Share via Facebook -
Share via Email
-
We know the world is not decarbonizing fast enough to reach global climate targets. But it turns out that no single country, anywhere, ever, has even achieved emissions progress of the scale needed.
There are two key relationships between fossil energy consumption and GDP. The first is carbon intensity of energy, or how much carbon is emitted per unit energy consumed. The second is energy intensity of the economy, or how much energy is required to produce a unit of economic growth. These separate but related relationships can help us understand if we’re decarbonizing fast enough to achieve global climate goals.
Over 1990-2015, the carbon intensity of world energy decreased by about 0.17% annually, and energy intensity of the economy decreased about 1.9% annually. That’s, well, pretty slow. To reach the international 2 degrees temperature target, global carbon intensity of energy needs to drop by about 8.5% annually to 2050 if world energy demand continues to rise at the historical 2% annual rate. That’s obviously radically faster than recent global progress, but how close have individual countries gotten? Take a look:
Fastest annualized decrease in Kaya metrics over a 10-year period

In short, no, no country has ever reduced carbon intensity or energy intensity at a rate that would be required to achieve global climate goals.
What can we learn from the countries that achieved the fast decarbonization rates, along each metric? Start with carbon intensity of energy.
To date, the countries that have most effectively decarbonized their energy supplies have relied on nuclear, hydro, and natural gas. France and South Korea decarbonized with massive build-outs of nuclear power. Brazil and Canada built hydroelectricity. Saudi Arabia replaced coal and petroleum with natural gas. No country in the top five had its best years of decarbonization in this century, or did so primarily with solar or wind.
The other leading source of decarbonization of the economy is structural change, i.e., a shift in the composition of the economy. All five of the top countries that reduced their energy intensity did so in the context of strong economic growth, particularly in less energy intensive sectors. For all five, energy consumption increased, but the economy grew much faster. From 1987 to 1996, Argentina’s economy more than tripled and shifted toward a service economy. Indonesia’s economy nearly tripled from 2003 to 2012, with highest growth in the service sector. Saudi Arabia’s apparent economic growth from 2002 to 2011 is a bit unusual. During those years, increasing price of oil increased industrial output in monetary terms, but there was little increase in energy demand. A similar phenomenon was at work in Russia, and in addition, Russia’s GDP increased by more than a factor of 2.5 from 1999 to 2008.
Decarbonizing the energy supply is not easy, but it is straightforward: heavy investments in low-carbon energy sources such as nuclear, hydro, solar, and wind do the job. Reducing energy consumption is much more complicated. Rapid economic growth might reduce energy intensity of the economy, but in all five of the the leaders for most rapid energy intensity reduction, absolute and per capita energy consumption both increased. At any rate, commanding high economic growth has generally proven to be easier said than done.
There are new tools to accelerate decarbonization, and we need newer ones still. Conventional nuclear energy has shown impressive growth in recent years, but not impressive enough globally to bend the decarb curve that sharply. Likewise, wind and solar are showing strong growth in certain markets, although how far those technologies can take us remains to be seen. The future is unwritten, but to achieve deep decarbonization and meet the world’s climate goals, the pace of decarbonization must be greatly accelerated. The history of nuclear and hydro deployment offer the best lessons.
Data and Methods
The best approach to understanding decarbonization is the Kaya identity. Any country’s total emissions from energy (CO2) is the product of four terms: (1) total population (Pop), (2) GDP per capita, (3) energy intensity of the economy (which is total energy divided by GDP), and (4) carbon intensity of energy (emissions per unit energy).
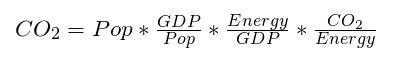
This is a mathematical identity. By definition, emissions cannot decrease unless one or more of these Kaya factors also decreases. If we want lower emissions, we must necessarily lower either population, the level of wealth, the energy intensity of the economy, or carbon intensity of energy. We cannot lower population directly, at least not humanely, and we generally prefer a higher level of wealth than a lower level. So that leaves energy intensity of the economy and carbon intensity of energy as the viable levers for policy to reduce emissions.
The emissions figures discussed here are only emissions from energy, which is where nearly two-thirds of anthropogenic greenhouse gas emissions come from. Reducing emissions from agriculture and other sources is also important to addressing climate change, but we’re not focusing on that in this analysis.
The gross domestic product of the 19 countries in the G20 is estimated using the purchasing power parity metric, with fixed 2011 US dollars. The figures are taken from Penn World Tables and the World Bank. All figures on energy and energy emissions are taken from the BP Statistical Review of World Energy.
The 10-year rates of improvement in energy intensity and carbon intensity of energy were calculated for all years since 1965 and for the G20 countries. The reported percentage changes are the average annualized rates of change of the given metric over a 10-year period. Only the single best value is reported per country and metric.