BP’s Annual Energy Rorschach Test
Progress and Disappointment in Global Energy Transition
-
-
Share
-
Share via Twitter -
Share via Facebook -
Share via Email
-
It’s finally summer, and energy wonks know what that means: the annual release of energy data from BP. While the data can be extremely useful for all manner of analysis and modeling, it also serves as tea leaves, allowing people to proclaim the truth of their preferred narrative, clearly reflected in the mess of data.
Renewables advocates will trumpet another record year for wind and solar, which is true. Climate hawks will caution that clean energy is not growing nearly fast enough and fossil fuels are still growing strong, which is also true. Nuclear supporters can breathe a small sigh of relief that nuclear generation continued its fifth year of growth post-Fukushima.
But what’s more important than cheering or bemoaning these individual trends is understanding the big picture of the global energy transition, the underlying drivers of these trends, and determining which can and cannot be influenced by policy and technological innovation. More sobering would be to question how effective our past policies have been: is this the amount of progress on clean energy we expect for the amount of effort we’ve put in? With this question in mind, let’s take a look at the notable trends in the BP data.
Most of the news is more of the same: global energy consumption and carbon emissions continued to rise, the carbon intensity of energy continued to fall, as did fossil fuel’s share of global energy.

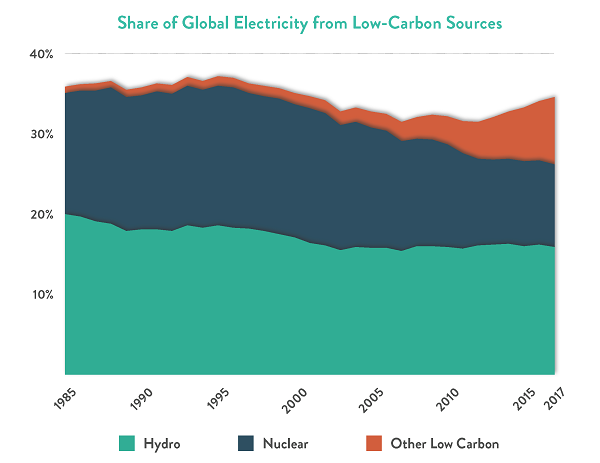
In positive news, wind and solar had a record year, with non-hydro renewables adding over 300 TWh of annual electricity generation. They now generate 8.5% of global electricity, almost catching up with nuclear at 10% and hydro at 16%. Interestingly, while we often think of the power sector as easier to decarbonize than energy overall, the record of low-carbon electricity is less impressive than primary energy. In 2017, all low-carbon sources made up 34% of global electricity generation, but that’s down from a peak of 37% in 1993. (In primary energy, low-carbon sources are currently at an all-time high of 15% of global energy consumption.) So electricity is much cleaner than primary energy, but it hasn’t changed much in thirty years, despite decades of renewables deployment incentives and mandates.
Worryingly, coal consumption for electricity grew by almost the same amount (270 TWh) as non-hydro renewables in 2017. In fact, coal’s continuing dominance globally is one of the most interesting stories buried in this data. Globally, coal is keeping pace with renewables in the power sector; we’ll explore the drivers of this trend in an upcoming post.

Our long-time readers won’t be surprised by our conclusion: the energy technologies we have today are not up to the task of rapid, deep decarbonization, so we need a much bigger push on innovation in zero-carbon alternatives, especially in the industrial and transportation sector.
But these regular releases of energy data should also serve as a reminder to all of us to check our priors and our biases, to look at the energy picture as a whole and not just the optimistic or pessimistic story we’d like to focus on, and to remain open-minded and curious about what policies and technologies might accelerate progress on decarbonization.